Image Embedding Models: Which to Use and Why Fine-Tuning Wins in 2026
What image embedding models are, how CLIP works, and how fine-tuning took us from 41% to 89% top-1 accuracy.

Matt Payne
July 16, 2026
A 2021 report estimated that the adoption of precision agriculture increased U.S. crop yields by 4% and broader adoption will potentially increase them by as much as 6%. Farmers, suppliers, agricultural marketing companies, and farm financing companies are just a few of the businesses in the industry that can expect to see their revenues grow by investing in precision agriculture.
Smart farming using artificial intelligence, deep learning, and computer vision provide the most promising path forward to achieve high yields quickly in a slow-moving industry. In this article, we’ll explain the kind of things AI-assisted computer vision can help you achieve in your agricultural business.

The illustration above shows the stages of an agricultural cycle and the activities in each stage. We’ll explore how computer vision for precision agriculture is being used to automate these activities.

Among all the factors that affect crop yield, soil wields the most influence. Soil properties decide which crops can be planted and how well they’ll grow. For example, corn needs well-drained loamy soil with a medium texture, high water retention, and containing particular levels of nutrients.
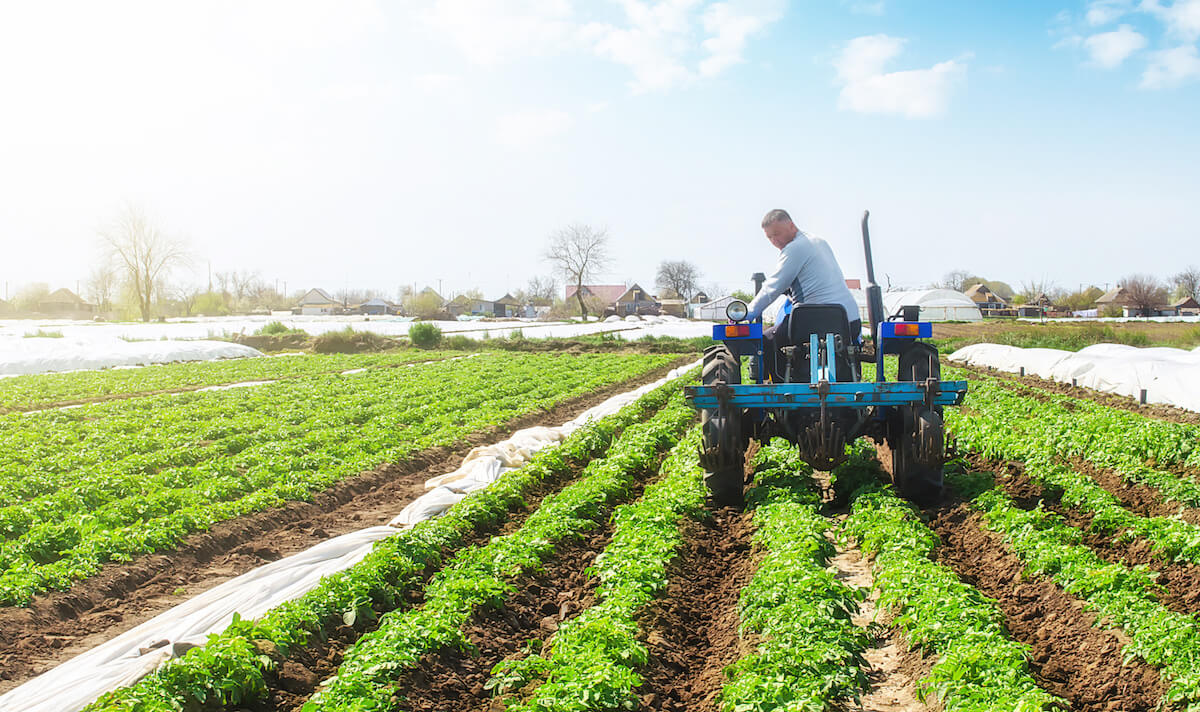
During the planning stage, farmers need to know the properties of the soil in every section of their farms for optimum crop planning and crop rotation. Traditionally, this is a time-consuming and labor-intensive process, but smart farming speeds it up dramatically with minimal human labor.

Digital soil mapping is done before the planting cycle starts. Multispectral cameras are fitted to drones or other unmanned aerial vehicles (UAVs) whose flight paths are automated.
As the drones fly around the farm at a height of about 50 meters, they collect imagery in the optical, near-infrared, and infrared bands at centimeter resolutions. The intensities of the radiation that a soil reflects or emits is its spectral signature. It embeds valuable information about soil properties like texture, soil moisture, acidity, minerals, and more.
The spectral video feed is sent to an edge device on the ground kept within the communication range of the drone. It cleans and processes the images by running computer vision algorithms either locally or in the cloud.

First, the images are pre-processed using image stitching, optical flow for video stabilization, deblurring, and so on to improve the accuracy of classification.
Once an image is cleaned up, the system is ready to segment its pixels. Soil properties can vary a lot even within a small area. Moreover, different soils may have irregular-shaped boundaries between them. That’s why we prefer pixel-level classification using semantic segmentation instead of area-level classification using object detection.
A deep neural network architecture for segmentation, like U-Net, is trained to classify different soils based on their spectral signatures. These training datasets are annotated by soil experts who mark pixel-level annotations on a set of training images.
When the drone’s video feed starts, the edge device runs this model on the feed. It generates a near-real-time semantic segmentation map for each frame where every pixel is classified as a particular soil or a non-soil pixel. We can box all of these algorithms together into a simple and easy to use computer vision system.
Every crop cycle depletes the soil’s nutrients and modifies its properties in particular ways depending on the crop grown in that area. To restore the area’s soil to its original state naturally, farmers use a crop rotation strategy — instead of replanting the same crop in an area, they plant a different crop (or sequence of crops) that restores the soil’s properties. For example, corn depletes the soil’s nitrogen content but it can be restored by planting legumes in that soil in the next cycle.
For effective decision-making on crop rotation, farmers need to know:
Machine learning algorithms give us the ability to learn the best fit combination of crops to optimize crop rotation and other agricultural processes.
The crop rotation problem can be a time series prediction problem — given a history of crop and soil maps, what will be the predicted soil conditions, and which crops are best suited for those conditions?
Computer vision applications help prepare the soil maps and crop maps (as described in other sections). It also helps convert these visual maps into numerical vectors that are suitable for time series prediction. Convolutional neural networks express the visual features — like crop boundaries, crop types, soil texture, and so on — as vectors.
These vectors are then supplied to the time series prediction model. Algorithms like random forests, XGBoost, recurrent neural networks, or even transformer networks are then used to predict the new soil variables.
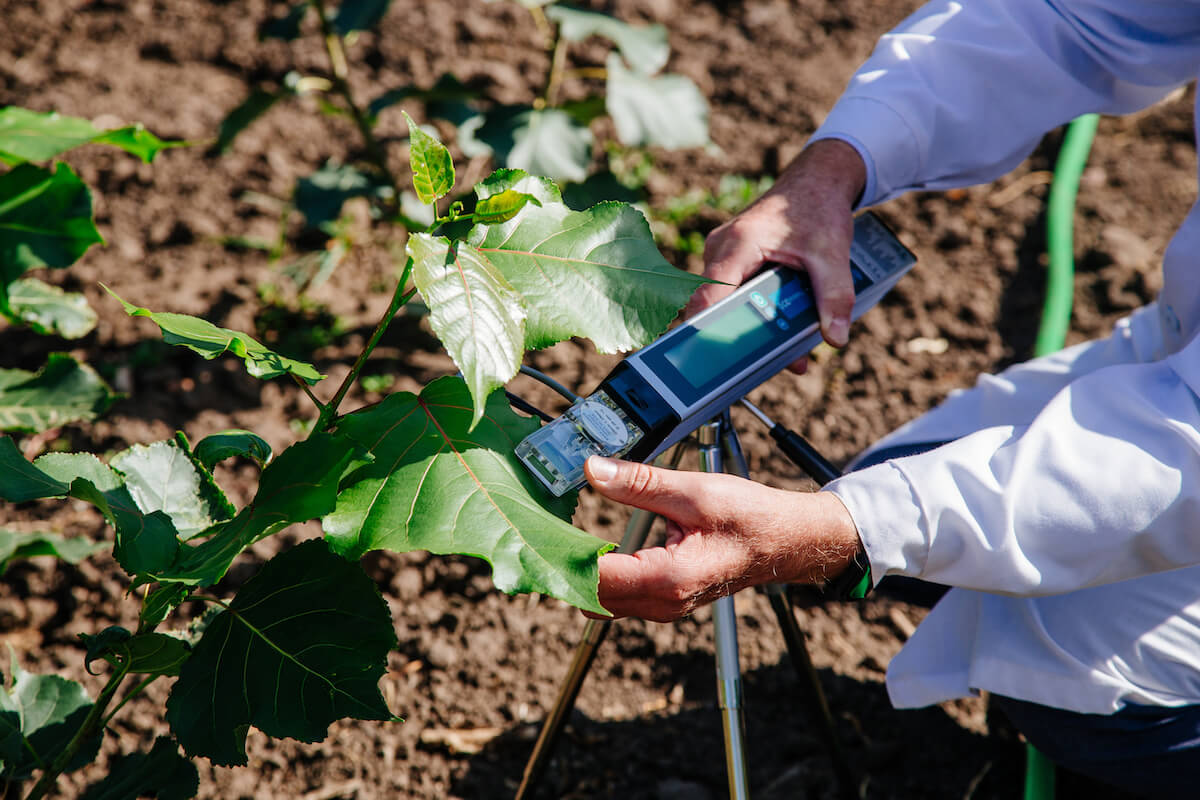
A crop’s phenotype refers to its physical characteristics like shape, size, appearance, texture, and so on. The phenotype directly affects the crop’s food grade and marketability.
The phenotype can be influenced by modifying specific genes of the seed. This mapping from the genotype to the phenotype is done by agricultural scientists, both in lab and field environments. During the planning stage, farmers can purchase seeds with suitable genotypes that will eventually produce crops with the desired phenotypes.
Automated edge devices, fitted with optical cameras or LIDAR sensors, drive around the farm capturing images of crops and sending them to an edge device. The edge device measures phenotype characteristics using the computer vision techniques explained next.

The raw images are first cleaned up using optical flow for video stabilization and image stitching to remove overlapping areas.
Next, an object detection neural network, like Yolo, is used to find parts of a crop like leaves, buds, seeds, flowers, stems, and so on.
Using photogrammetry, images of a crop are combined to create 3D versions which are easier to measure accurately. Finally, parts of the plant are measured visually against calibrated reference measurements to get values for each of the phenotype characteristics.

Crop mapping classification can also be used alongside time series models for crop yield estimation.
Crop maps identify the crops grown in an area over time, along with accurate georeferencing. They are critical to many agricultural applications like yield estimation, crop rotation planning, agricultural policies, insurance agencies, and more.
Data for crop mapping can come from a variety of sources:
Data from drones or robots is first sent to a nearby edge device (like a laptop) over wireless technologies like LoRa or narrowband IoT (Internet of Things). The data is then processed either locally or in the cloud using computer vision.
We combine several image processing, video processing, traditional computer vision, and state-of-the-art deep learning technologies to prepare crop maps.
The images and videos taken from moving platforms like drones and robots suffer unwanted effects like motion blurs, image overlaps, and sensor noise. To clean them up, we use image and video processing algorithms like:
Satellite imagery may require cloud removal and image stitching to prepare them for the next phase.

Crop map preparation is fundamentally a classification problem to answer the question: What is the thing that’s growing in a particular area? Because georeferencing is essential, you need localization in addition to classification.

Both object detection and semantic segmentation are capable of localizing and classifying. The former reports a single class for an entire rectangular area of pixels while the latter classifies every pixel.
The preferred method depends on the input data. On satellite images, pixel-level segmentation is preferred because every pixel represents anywhere from 100 square meters to half an acre of crops. Pixels of the same class are then combined using clustering.
But for drone and robot images with centimeter resolutions, we prefer object detection because segmentation’s fine-grained results are too noisy and simply unnecessary.
About $300 billion was lost due to plant diseases and invasive insects and about 20-40% of global production was lost to pests — these are the losses reported by the UN Food and Agriculture Organization. Monitoring crop health for diseases and pests is vital to reduce these losses and meet yield targets.
Crop diseases leave telltale signs on leaves, fruits, or other parts of a crop. Pests and insects can be identified by setting up automated motion detection.
Both monitoring tasks are done using automated robots fitted with cameras and infrared sensors. The exercise may also include farm workers using smartphone-based recognition apps for closer inspections. Video feeds from the robots and the apps are sent to an edge device that processes them locally or in the cloud.
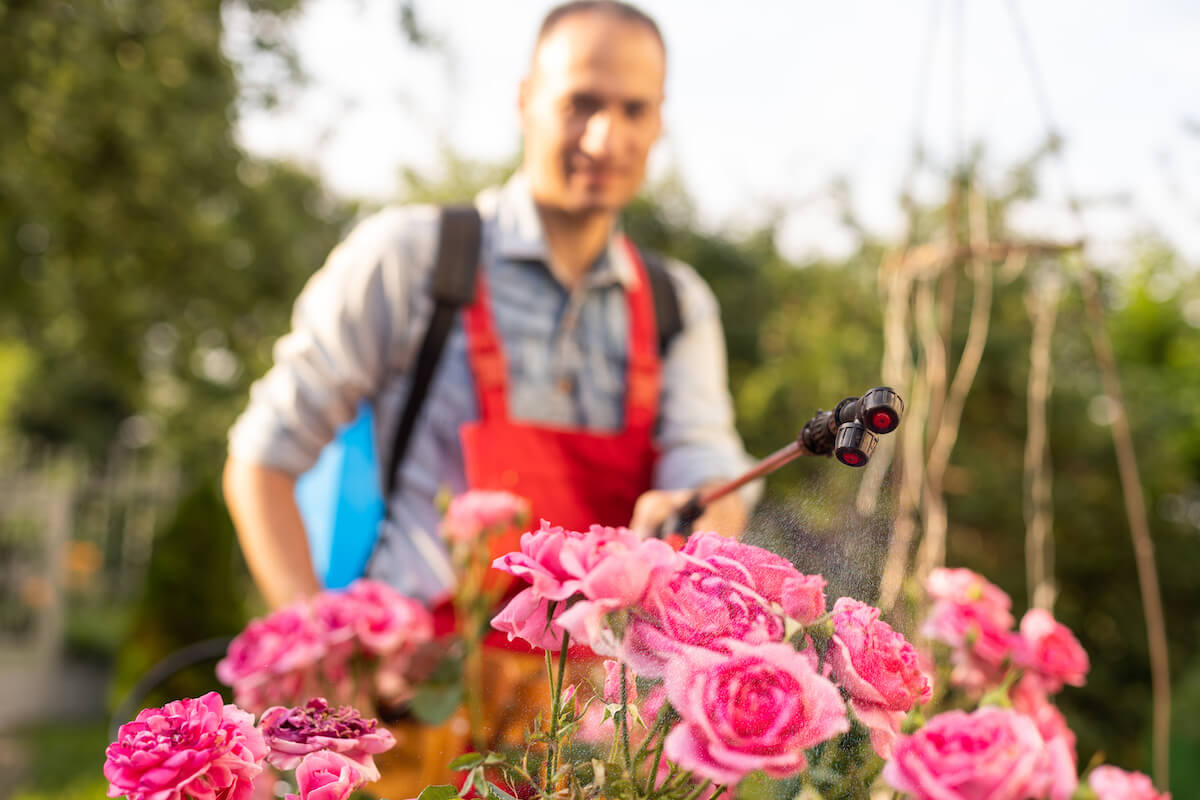
When a disease or pest is detected using computer vision, that area is micro-targeted by the robot for localized treatment using pesticides or herbicides. Alternatively, a beneficial companion crop — like onions for carrots — is suggested to ward off a pest.
Diseases often manifest as irregularly shaped discolorations and damage to different parts of the crop. The diseased areas are localized using deep learning algorithms for object detection or semantic segmentation. Though segmentation is slower, its higher accuracy is useful for automated treatment. Both techniques are done using deep convolutional neural network models like Yolo or U-Net.
For closer inspection by farm workers, smartphone-based deep learning models like MobileNet are used for disease detection.
These object detection models are also used for pest and insect detection. In addition, motion detection and object tracking techniques like background subtraction, optical flow, and Kalman filter are used to track pests and insects as they move.
Yield prediction forecasts the amount of likely produce per unit of land area. It’s used at the start of a farming cycle by many players in the value chain:
Yield prediction is largely based on the current soil map and historical crop map data.
Yield estimation is done throughout the crop production stage to foresee any risks and ensure that the final yield matches the predicted yield. Yield estimation includes additional information about the planted crops like their genotypes and phenotypes, growth rates, diseases, and so on.
Yield estimation is a regression problem — given the soil map, crop map, phenotype measurements, disease rates, weather conditions, and other environmental factors, predict the yield per unit area based on historical yields. These four or five sets of input information consist of hundreds of factors between them with all kinds of effects on one another.
Hence, robust non-linear regression models like XGBoost or deep neural networks provide the most accurate results over simple statistical models. Let’s explore how computer vision is used in this process.
We’ve already explored how computer vision is used for all the subtasks that contribute to yield estimation — soil maps, crop maps, plant phenotyping, and disease detection.
But computer vision is used a second time in this pipeline. A deep convolutional neural network extracts characteristic visual features from the soil and crop maps and converts them to numerical vectors that can be input to the non-linear regression model.
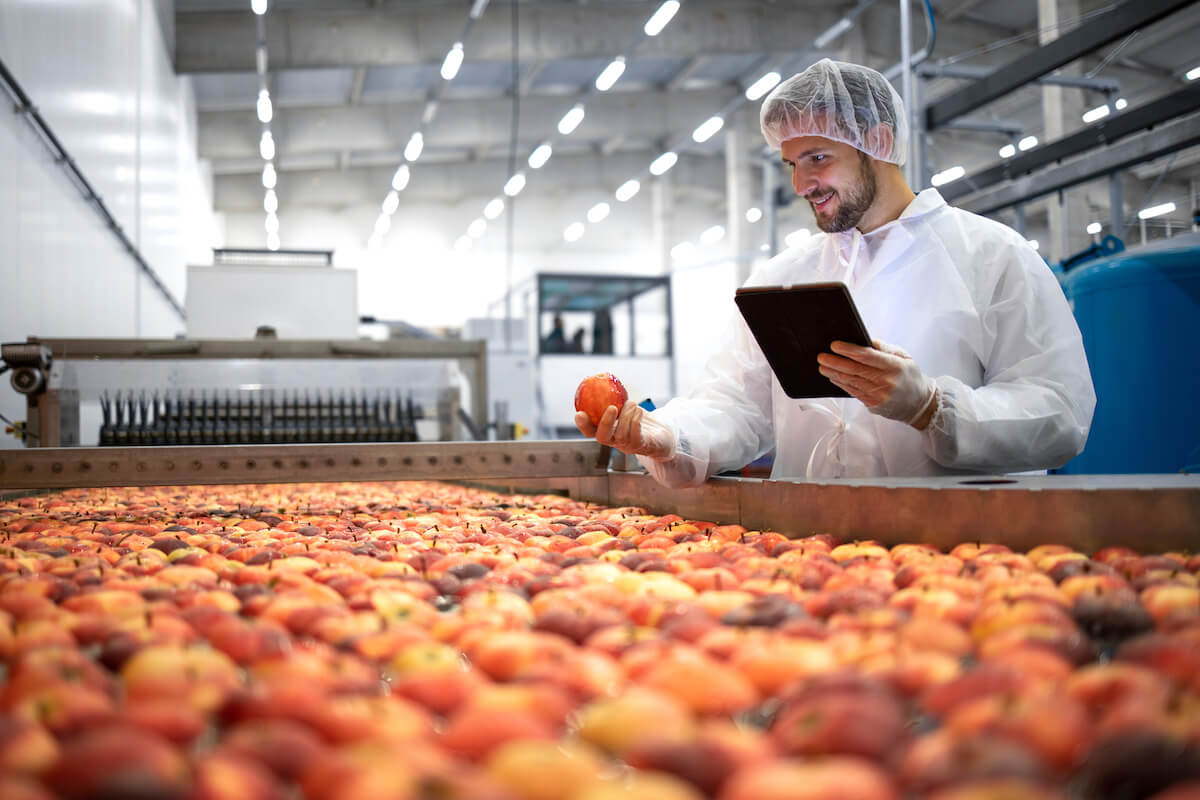
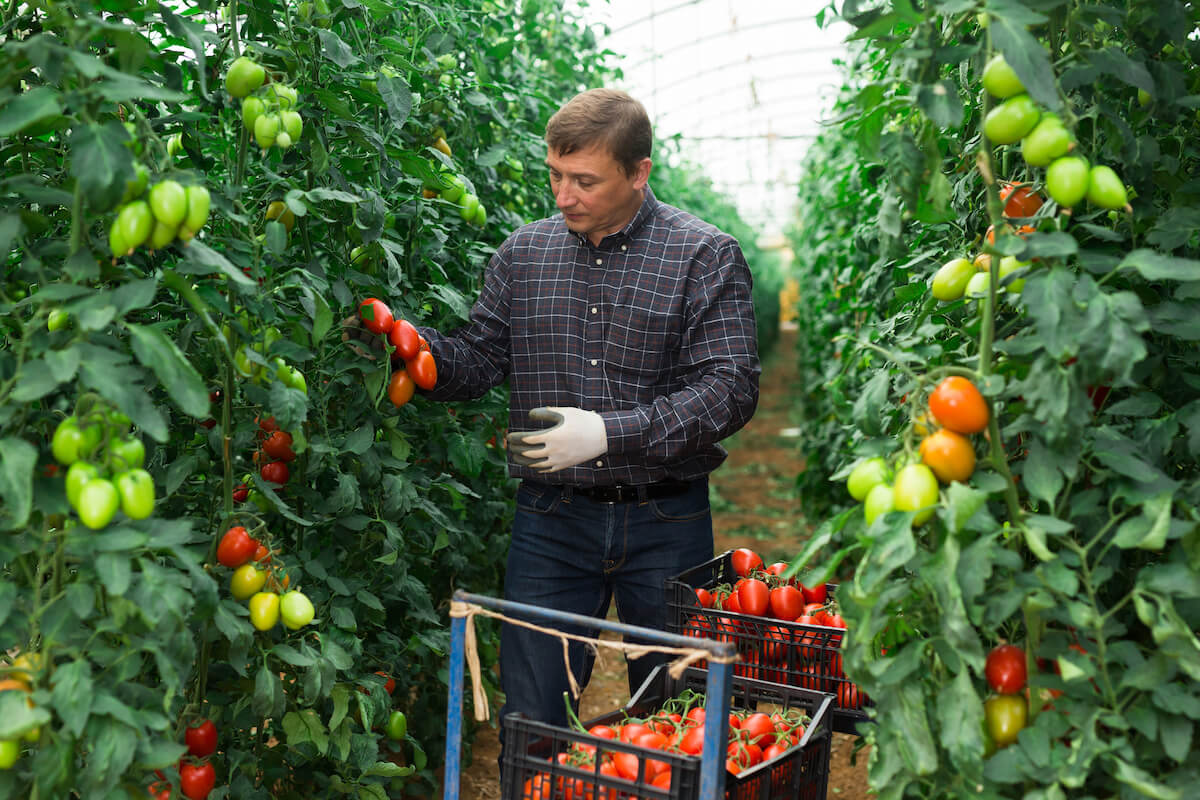
One of the most important applications of computer vision is in quality control of harvested produce. All governments specify quality standards for them and impose fines for not meeting them. For example, the U.S. Department of Agriculture specifies minimum sieve sizes, minimum weights, and limits on the foreign material in corn. Every product is given a food grade based on how well it meets the standards.
The rest of the supply chain and end customers too have expectations of the quality. Each food grade is destined for different market segments. For example, exporting produce is often highly profitable but involves meeting the highest food grades and quality thresholds.
So, precision is vital for quality control. Unlike the field-based systems we’ve seen so far, quality inspections are done inside food processing plants by purpose-built machine vision systems with sophisticated detection, non-invasive testing, and measurement capabilities.

Traditional image processing techniques are widely used here because, unlike in the field, the system can easily create the ambient conditions necessary for the ML algorithms to return accurate results. The following techniques are common:
Using photogrammetry and camera calibration, dimensions can be measured accurately.
For complex products that show a lot of variety — like greens, fruits, and vegetables — deep neural networks are preferred because they can classify, detect, or segment complex objects accurately.
Whether you’re a farmer, marketer, supplier, bank, insurer, or involved in some other way in the agricultural sector, our extensive experience in computer vision and deep learning are available to help you implement agricultural automation in your business. Contact us!

